Define the territory
Set the Tbilisi urban extent, ten named street corridors and a 240-cell planning grid.

LGM Research · Tbilisi · 24 August 2026
LGM turned a broad city question into an evidence-backed shortlist of streets, districts and investment opportunities—then kept the data, method and limitations visible.
Citywide evidence
LGM combined transport, places, land use, infrastructure, water, elevation and soil through one recursive MCP workflow.
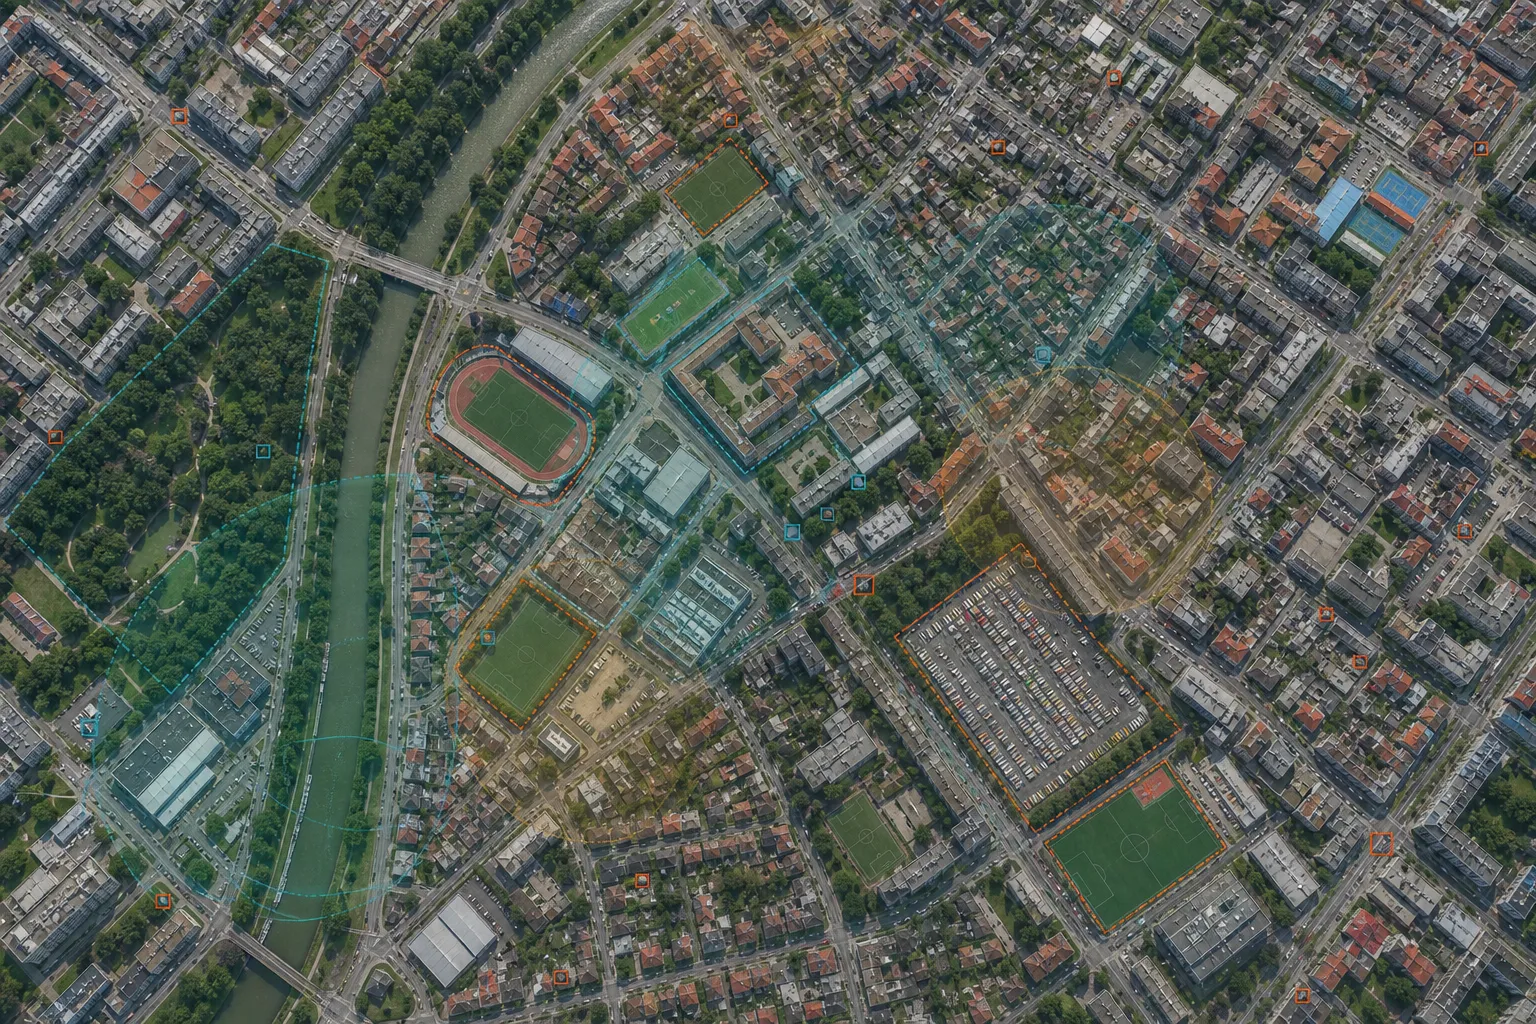
The city is not one condition
Tbilisi ranges from approximately 360 to 1,410 metres within the research extent. A street standard that works in one district may fail in another because slope changes walking access, drainage, public transport and emergency response.
The research therefore did not search for one universal answer. It compared corridors and neighbourhoods, looking for repeated signals that justify a closer field or municipal study.
How the research ran
The MCP server supplied raster, vector and search tools. Codex orchestrated the calls, recovered from result limits and assembled the evidence.
Set the Tbilisi urban extent, ten named street corridors and a 240-cell planning grid.
Select Overture, OpenStreetMap, elevation and soil tools through one MCP connection.
Split oversized queries into quadrants until every response falls below the 2,000-object limit.
Reconstruct named corridors, merge fragments and remove overlapping IDs before comparison.
Measure mapped access, activity, infrastructure, terrain and land-use signals by corridor and cell.
Publish candidate areas with evidence, assumptions and the checks required before a decision.
Evidence base
The clean analytical pass involved at least 117 actual MCP calls. Exact historical tokens were unavailable because usage metadata had not yet been enabled.
Businesses, services and amenities
Crossings, stops, benches, kerbs and signals
Residential, commercial, industrial and redevelopment
Unique corridor segments after deduplication
Elevation samples across city and corridors
Comparable cells of roughly 1.25 × 1.67 km
Sources: Overture Maps release 2026-07-22.0, OpenStreetMap Nominatim, LGM Elevation and LGM Soil. The measured 18m 08s covers the artifact timeline—including MCP waits, local calculations, documentation and corridor checks—not pure server compute. A retrospective clean-pass estimate under the later lgm-0.9 rate is approximately $12–14.5.
Most important district signal
The same territory repeatedly surfaced across retail access, district employment, education and sport. That makes a coordinated mixed-use intervention more compelling than four disconnected projects.
Where to investigate next
A useful city model should not produce one generic heatmap. It should surface a different evidence set for each decision.
A repeated signal across daily retail, district services, education and sport makes this the strongest multi-factor priority.
The strongest combined gap signal for schools, kindergartens and multifunctional sports infrastructure.
A natural fit for freight, light industry, last-mile operations and the B2B offices that support them.
Housing near brownfield and construction activity warrants a technical audit before address-level intervention.
Street screening
These are comparative mapping signals, not proof that physical infrastructure is absent. Every recommendation begins with a field audit.
| Rank | Corridor | Sidewalk / motor | Crossings | Cycleway | Places | First move |
|---|---|---|---|---|---|---|
| 1 | Tsereteli Avenue | 6.5% | 2.38/km | 0.20 km | 518/km² | Fast field-audit pilot |
| 2 | Kakheti Highway | 3.2% | 0.39/km | 0 km | 56/km² | Reduce the barrier effect |
| 3 | Gorgasali Street | 18.2% | 0.47/km | 0.81 km | 70/km² | Reconnect east and centre |
| 4 | Ketevan Tsamebuli Ave. | 22.7% | 2.57/km | 0.21 km | 281/km² | Close walking and cycling gaps |
| 5 | Chavchavadze Avenue | 26.7% | 4.35/km | 1.67 km | 873/km² | Step-free access on steep terrain |
Audit sidewalk continuity, accessible crossings and links to stops, schools and markets. Its relatively flat corridor makes rapid universal-access improvements easier to test.
Test safe crossing intervals, continuous shaded walking routes and access to public transport. The primary question is how to reduce a long car-oriented barrier.
Example decision · Public market
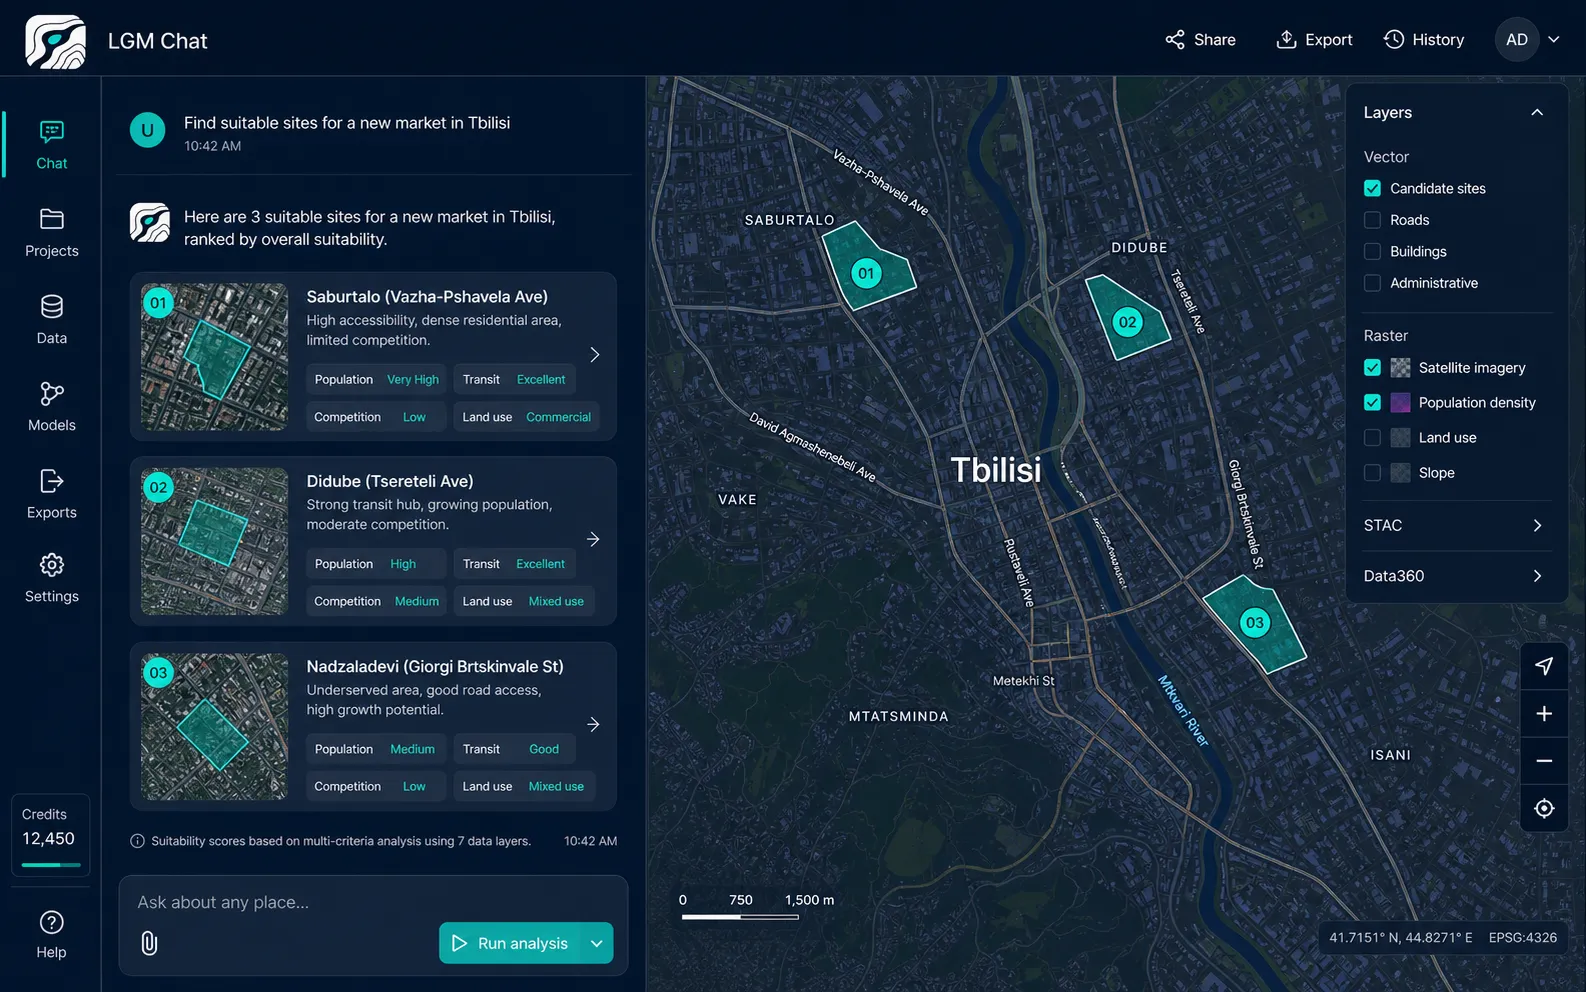
These bounding boxes are deliberately small enough for land, footfall, ownership and field checks. They are candidate search areas—not selected plots.
51 residential polygons · 27 stops · 1 mapped retail-supply object
Distributed street retail: fresh food, pharmacy, household services and cafés.102 residential polygons · 31 stops · 13 retail-supply objects
A compact district centre with a 10–20 stall fresh market and daily services.46 residential polygons · 9 stops · no mapped retail supply
Daily-needs cluster: grocery, pharmacy, delivery, childcare and household services.From evidence to interface
A user can start with a city question, inspect the selected tools and sources, then continue with map-ready geometries in GIS instead of treating the answer as opaque text.
What the test proved
Tool discovery, recursive subdivision, vector and raster collection, street reconstruction and evidence assembly all worked in one agent workflow.
See the MCP Server →What improves next
Before capital is committed
Mapped absence is not physical absence. The next stage must add population and footfall, traffic and crashes, transit frequency, property and land data, building condition, school capacity, climate exposure and on-site validation.
Soil-depth responses also require validation: the 5, 30 and 100 cm requests returned identical files. That transparency is part of the product—LGM should show not only what the evidence suggests, but also what it cannot yet support.
Bring your territory